B2B
Merit Based Incentive Payment System (MIPS)
Modernizing Medicare to provide better care and smarter spending


Overview
About the project
The Merit-based Incentive Payment System (MIPS) is a new way by which eligible clinicians will be measured by Dept. of Health Services to determine if they are providing quality patient care in an economically efficient way.
Regenstrief Institute wanted to build an online platform for physicians & healthcare advisors to report & track performance efficiently thereby decreasing administrative burdens.
My Role:
User Research, Interaction, Visual
design, Prototyping & Testing
Duration:
Jun 2020 - Dec 2020
In 2017, 73% of hospitals were penalized by the govt. due to their inability to report data
about the quality of service provided to the patients. Tracking this data can prevent
penalties and ensure that better care is provided.
Create a performance data reporting system to reduce the
overall administrative burdens for physicians and advisors
The Challenge
MIPSight Web App
MIPSight Web App
A customizable web-based application which can record data, generate scorecard and conduct what-if analysis to save time and provide meaningful insights.
Dashboard
MIPSight
All Reports
Create Report
Scorecard
Providers
Contact
Harriet Becker
6-7-14
0
100
200
300
400
500
12-8-15
6-18-15
1-1-16
16-4-16
12-12-16
5-20-17
80
50
90
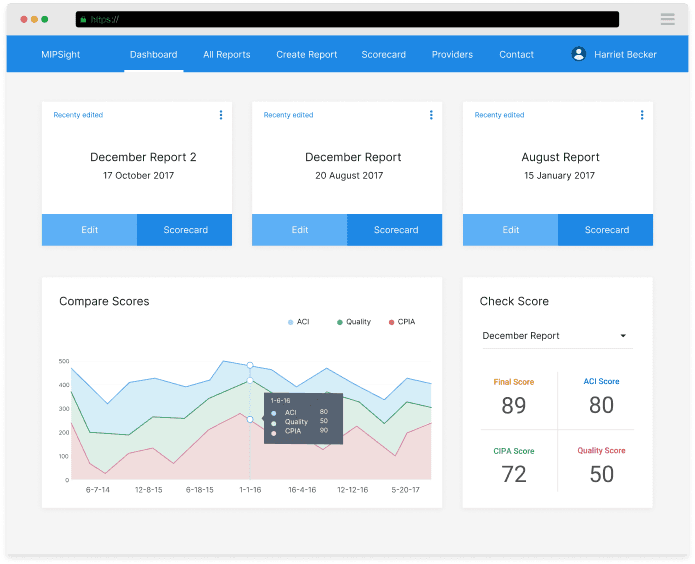
ACI
Quality
CPIA
1-6-16
CPIA
Quality
ACI
Compare Scores
20 August 2017
December Report
Edit
Scorecard
Recenty edited
17 October 2017
December Report 2
Edit
Scorecard
Recenty edited
15 January 2017
August Report
Edit
Scorecard
Recenty edited
December Report
Check Score
mipsight.com
://
https
1. Dashboard
A dashboard which shows all the important
& frequently used features at one place to
navigate faster. Users can quickly view, edit
and compare scores from different reports.
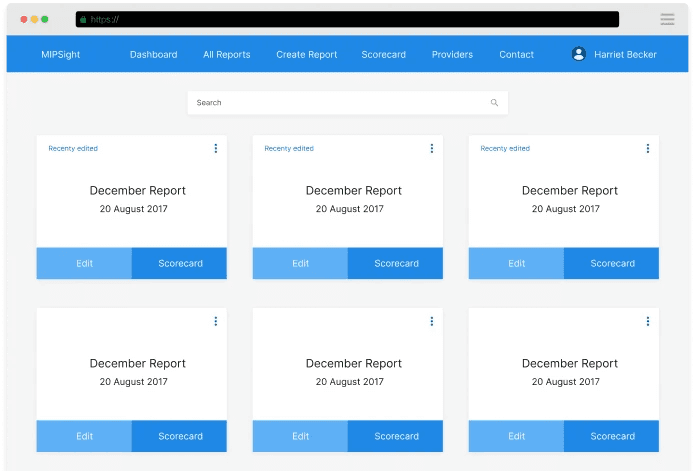
2. Manage Reports
All the reports are saved and organized
automatically by the date created. Users
can search sort and filter the reports based
on their date, score and edit history.
3. View Report
In these individual reports, users can add,
edit, search, and import data in the tables.
They can also generate scorecards of the
reports in real time.
Dashboard
MIPSight
All Reports
Create Report
Scorecard
Providers
Contact
Harriet Becker


mipsight.com
://
https
Edit Report 12-12-17
Dashboard
MIPSight
All Reports
Create Report
Scorecard
Providers
Contact
Harriet Becker
Rows per page:
10
1-10 of 100
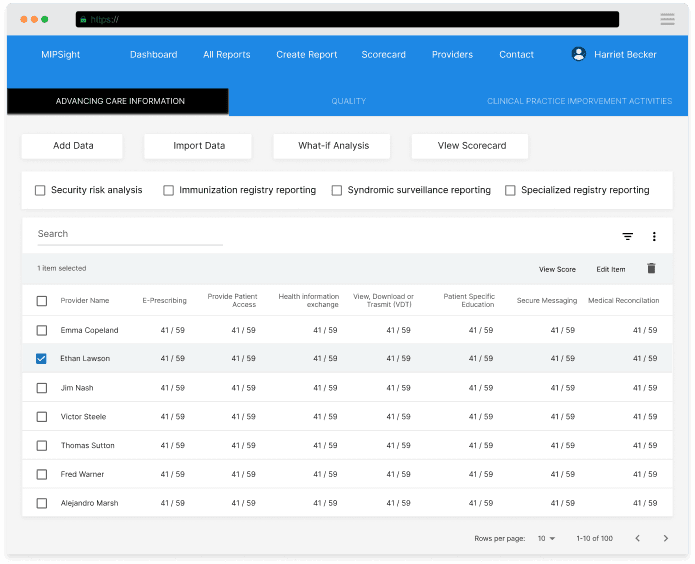
Emma Copeland
Thomas Sutton
Jim Nash
Alejandro Marsh
Provider Name
1 item selected
Edit Item
View Score
Ethan Lawson
Fred Warner
Victor Steele
41 / 59
41 / 59
41 / 59
41 / 59
E-Prescribing
41 / 59
41 / 59
41 / 59
41 / 59
41 / 59
41 / 59
41 / 59
Provide Patient
Access
41 / 59
41 / 59
41 / 59
41 / 59
41 / 59
41 / 59
41 / 59
Health information
exchange
41 / 59
41 / 59
41 / 59
41 / 59
41 / 59
41 / 59
41 / 59
View, Download or
Trasmit (VDT)
41 / 59
41 / 59
41 / 59
41 / 59
41 / 59
41 / 59
41 / 59
Patient Specific
Education
41 / 59
41 / 59
41 / 59
41 / 59
41 / 59
41 / 59
41 / 59
Secure Messaging
41 / 59
41 / 59
41 / 59
41 / 59
41 / 59
41 / 59
41 / 59
Medical Reconcilation
41 / 59
41 / 59
41 / 59
ADVANCING CARE INFORMATION
QUALITY
CLINICAL PRACTICE IMPORVEMENT ACTIVITIES
Security risk analysis
Immunization registry reporting
Syndromic surveillance reporting
Specialized registry reporting
Add Data
Import Data
What-if Analysis
VIew Scorecard
Search
mipsight.com
://
https
3. View Report
In these individual reports, users can add,
edit, search, and import data in the tables.
They can also generate scorecards of the
reports in real time.
4. Scorecard
A scorecard visualizes the report to show
meaningful insights such as indivual
performance, top providers, and overall
score which can be downloaded anytime by
the users.
Result Report 12-12-17
Dashboard
MIPSight
All Reports
Create Report
Scorecard
Providers
Contact
Harriet Becker
ACI PROVIDER LEVEL SCORECARD
ACI TIN LEVEL SCORECARD
QUALITY SCORECARD
What-if analysis
Advancing Care Information
Bobby Howell
Dean Hogan
Andre Gomez
Provider Name
1 item selected
Download Selected
Sean Peters
Lora Strickland
50
0
0
Base Score
50
50
73
10
10
Performance
Score
80
90
5
5
5
Bonus Score
5
5
140
0
0
Final Score
154
159
41 / 59
41 / 59
41 / 59
E-Prescribing
41 / 59
41 / 59
41 / 59
41 / 59
41 / 59
Health information
exchange
41 / 59
41 / 59
41 / 59
41 / 59
41 / 59
Provide Patient
Access
41 / 59
41 / 59
Owens
Sophie
Jessie
Dixon
Derrick
Lela
10%
0%
20%
30%
Top Providers
Age
Performance
52.4%
31.2%
16.4%
Base Score
Bonus Score
97
Organization Score
Final Score
Overview
790
Average Provider Score
0
1000
Performance
Last 6 month
ACI score growth
6.43%
Provider Growth
9.43%
mipsight.com
://
https
Download


4. Scorecard
A scorecard visualizes the report to show
meaningful insights such as indivual
performance, top providers, and overall
score which can be downloaded anytime by
the users.

User Testing &
Evaluation
Wireframing &
Prototyping
Brainstorming
different ideas
Identifying pain points
of users
Stakeholder
interviews
Understanding the
context (MIPS)
User Testing &
Evaluation
Wireframing &
Prototyping
Brainstorming
different ideas
Identifying pain points
of users
Stakeholder
interviews
Understanding the
context (MIPS)
Understanding the
context (MIPS)
Stakeholder
interviews
Identifying pain points
of users
Brainstorming
different ideas
Wireframing &
Prototyping
User Testing &
Evaluation
The Process
I collaborated with the researchers and domain experts in the team to understand our core users, their environment, and majors tasks to accomplish. We interviewed few participants and gathered data on their current workflow and major challenges. This data helped us in finding opportunites to solve the problems.
I collaborated with the researchers and domain experts in the team to understand our core users, their environment, and majors tasks to accomplish. We interviewed few participants and gathered data on their current workflow and major challenges. This data helped us in finding opportunites to solve the problems.
Interviews & Observations
User Research
User Research
Interviews & Observations
I collaborated with the researchers and domain experts in the team to understand our core users, their environment, and majors tasks to accomplish. We interviewed few participants and gathered data on their current workflow and major challenges. This data helped us in finding opportunites to solve the problems.

The users of this tool are Quality Improvement Advisors (QIA). QIA's acts as an internal consultant and resource to a health organization with the goal of driving improvement in quality, cost efficiency and patient satisfaction. They gather, compile and analyze clinical reports, identify gaps / strengths & make appropriate
recommendations for corrective actions.
The users of this tool are Quality Improvement Advisors (QIA). QIA's acts as an internal consultant and resource to a health organization with the goal of driving improvement in quality, cost efficiency and patient satisfaction. They gather, compile and analyze clinical reports, identify gaps / strengths & make appropriate recommendations for corrective actions.
Who are the users?
Target Audience
Participants
We chose four QIA (Quality Improvement
Advisors) to interview. Interviews conducted were
semi- structured in nature. All from different
health organizations such as IU Health, Purdue
Health etc.
We chose four QIA (Quality Improvement Advisors) to interview. Interviews conducted were semi- structured in nature. All from different health organizations.
Interviews Script
1. What's the context?
2. What are your major tasks?
3. How do you report & analyze data?
4. What are the major problems faced?
5. How do collaborations happen?
6. What tools do you currently use?
Observations
Observations were conducted to get and
understanding the QIA's process of data
collection from various pysicians and providers
and to study the tools / mediums used in their
current workflow.
Observations were conducted to get and understanding the QIA's process of data collection from various pysicians and providers and to study the tools / mediums used in their
current workflow.
Users mainly use MS Excel
spreadsheets to enter data
& frequently edit values in
the tables to compare their
scores.
Users want to see the results
in a concise and visual
format which is easy to
understand, share with
stakeholders.
QIAs' want to quickly find
and organize relevant data
and practises from several
others in the list.
Due to the complexity of
calculations they often fail to
complete & deliver
meaningful analytics on time.
Users want to see the results
in a concise and visual
format which is easy to
understand, share with
stakeholders.
Users mainly use MS Excel
spreadsheets to enter data
& frequently edit values in
the tables to compare their
scores.
QIAs' want to quickly find
and organize relevant data
and practises from several
others in the list.
Due to the complexity of
calculations they often fail to
complete & deliver
meaningful analytics on time.
Research Insights
Understanding the user
After conducting interviews and observations I created user personas with information about their behaviors,
technologies used, pain points & their needs. View Persona
After conducting interviews and observations I created user personas with information about their behaviors,
technologies used, pain points & their needs.
After conducting interviews and observations I created user personas with information about their behaviors, technologies used, pain points & their needs. View Persona
MS Excel
MS Excel
Journal
Journal
Gmail
24%
24%
14%
14%
51%
51%
11%
11%
Other
Other
Tools Currently Used
Tools Currently Used
Reporting Data
Recommending
Percentage
Calculating Results
Organizing Data
Analyzing Results
Most Time Consuming Tasks
10%
15%
17%
22%
6%
Problem Space
Issues Found
1. Long reports and high error rates
3. Organizing & searching data in reports
2. Tedious process to analyze the data
4. Time consuming calculations in Excel

Journey Mapping
Identifying use case
Brainstorming
Sketching initial ideas

Brainstorming
Sketching initial ideas

Information Architecture
User flow diagrams

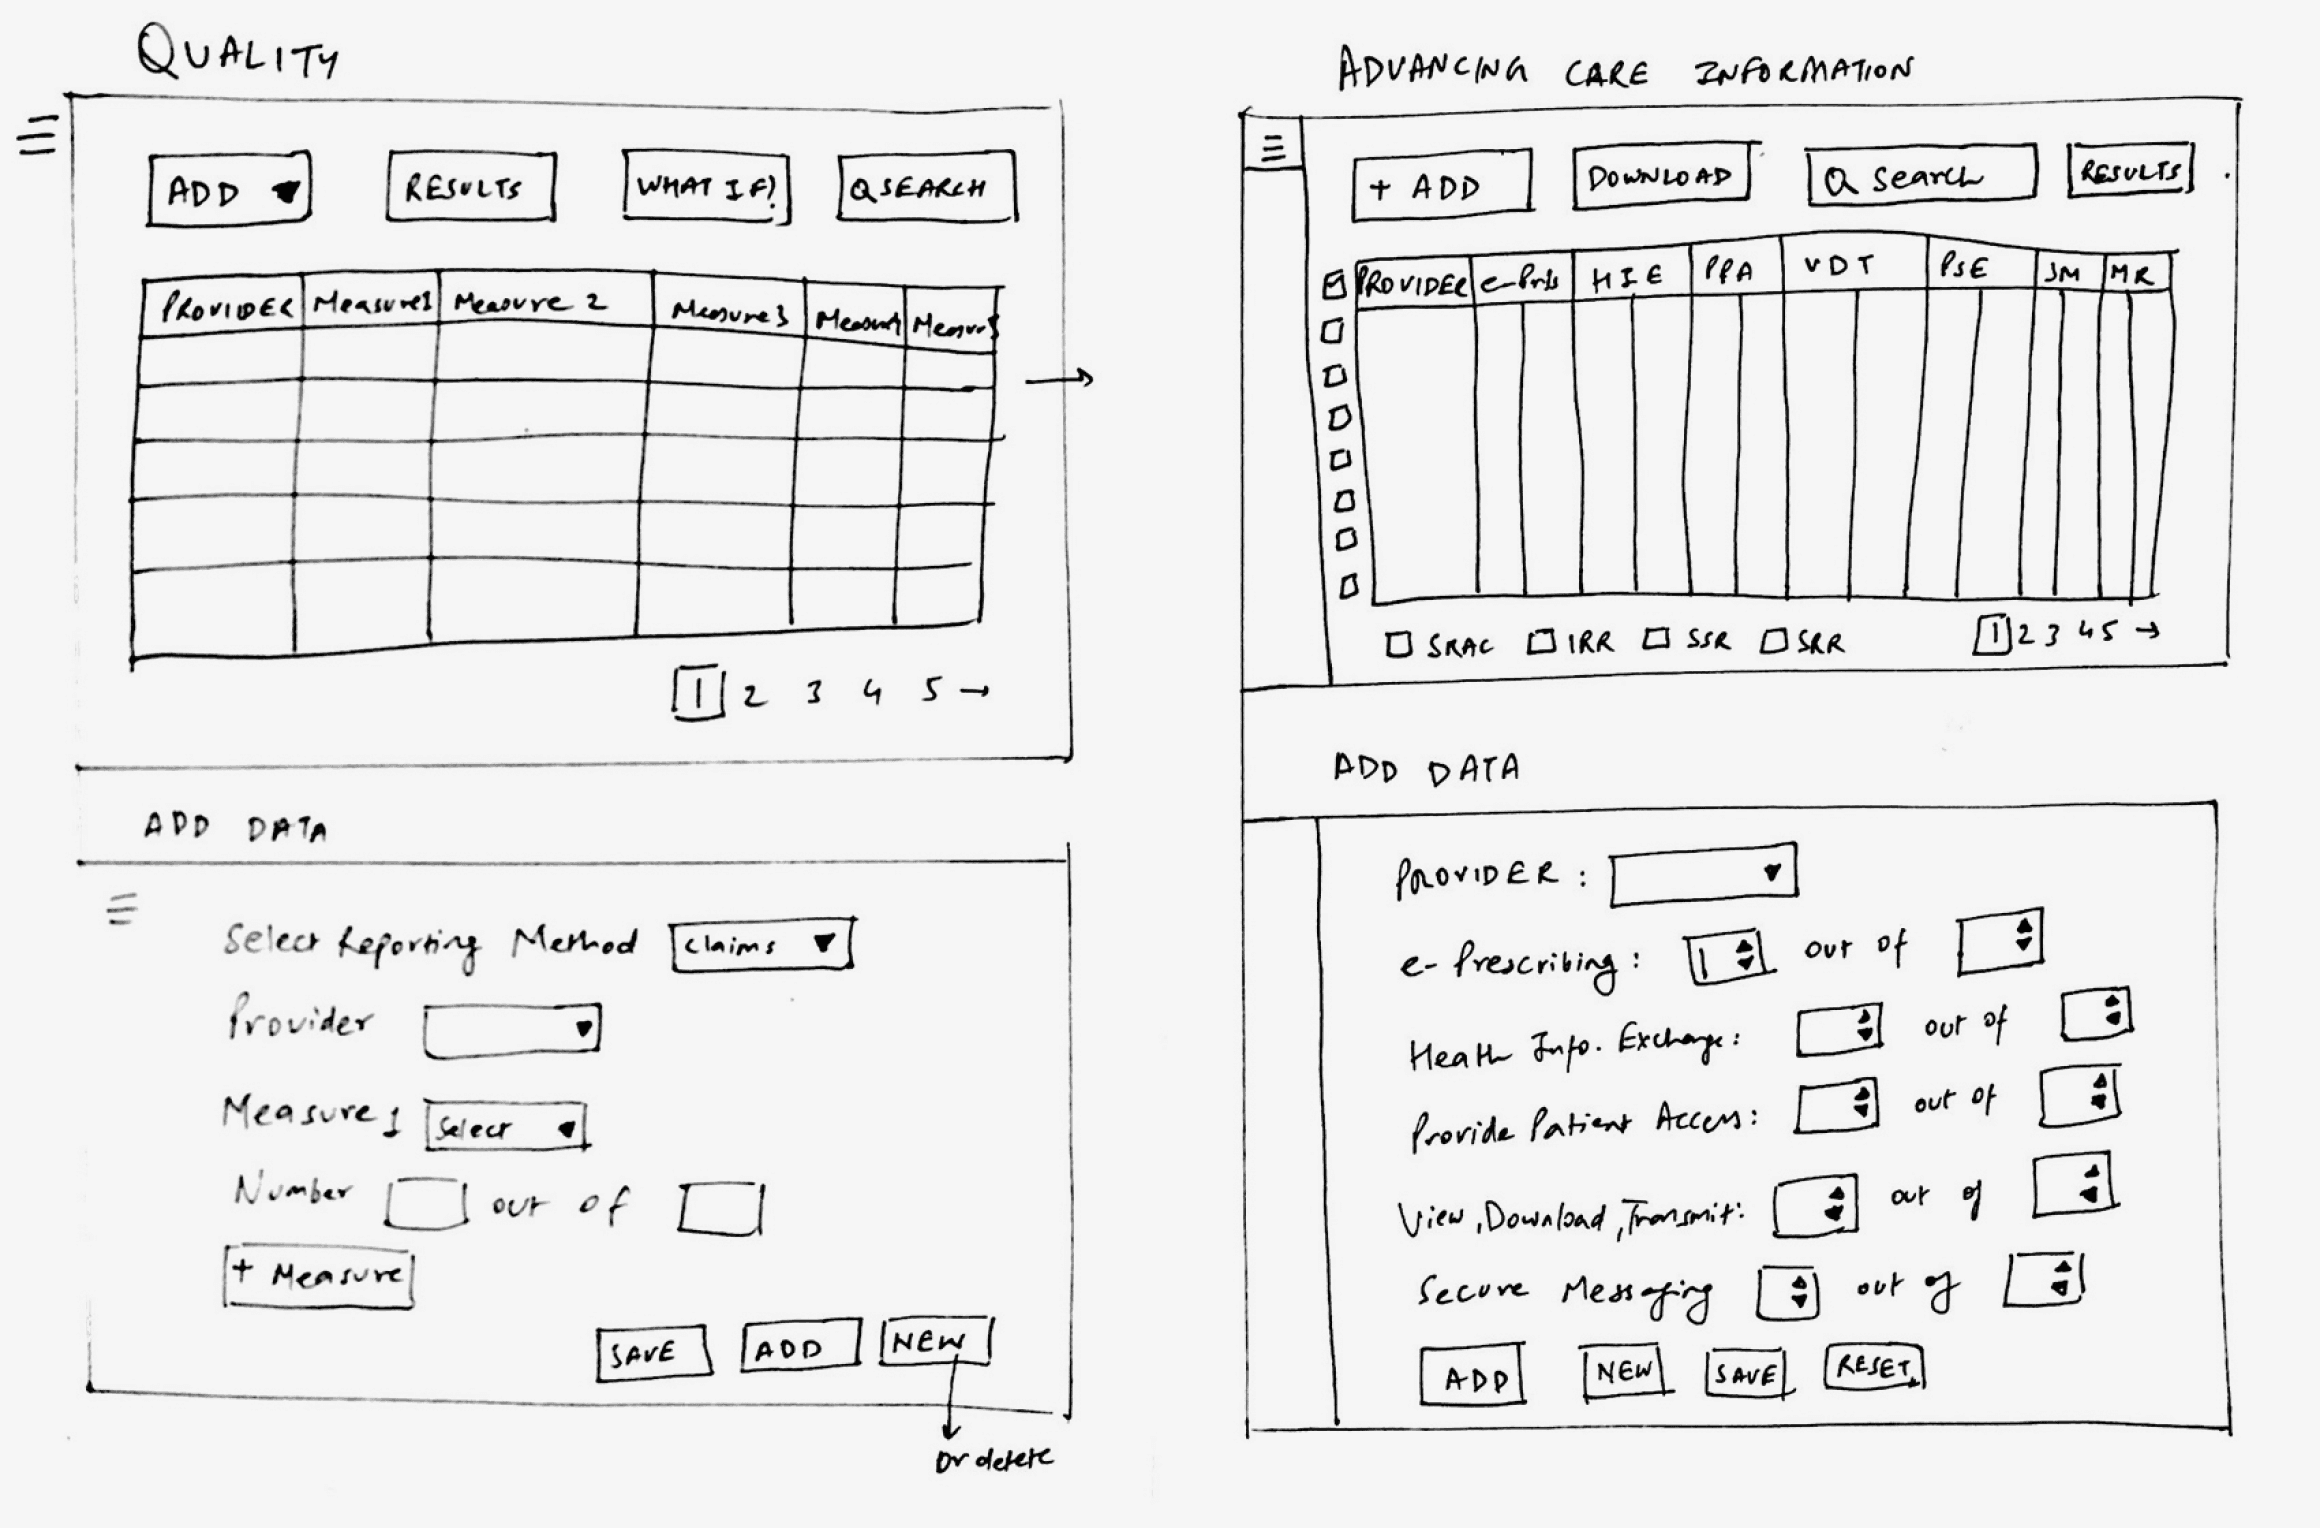
Wireframing
Iterating user interface
As we moved on to designing the interface of the application, I wireframed all the UI screens and conducted an
intial user testing session.
As we moved on to designing the interface of the application, I wireframed all the UI screens and conducted an intial user testing session.
Defining Patterns
Design Style Guide

High Fidelity
Visual Design

Conclusion
Overall Impact
The web app is currently used by Quality Improvement Advisors (QIA) to guide 15,000+ clinicians across
universities, health systems and independent provider-practices in major of the domestic states
This tool is helping healthcare institutions to save thousands of dollar and increasing the quality of patient care by
incentivising the performance of physicians, providers etc.
This tool is helping healthcare institutions to save thousands of dollar and increasing the quality of patient care by incentivising the performance of physicians, providers etc.
Conclusion
Overall Impact
The web app is currently used by Quality Improvement Advisors (QIA) to guide 15,000+ clinicians across
universities, health systems and independent provider-practices in major of the domestic states
This tool is helping healthcare institutions to save thousands of dollar and increasing the quality of patient care by
incentivising the performance of physicians, providers etc.
Learnings
Handling Missing Values
Implementing DAX for Analysis
Dynamic Visualization Control
Implementing Row Level Security
Report Publishing and Sharing
Scheduling Data Refresh
Best Practices in Power bi Implementations

4. Scorecard
A scorecard visualizes the report to show
meaningful insights such as indivual
performance, top providers, and overall
score which can be downloaded anytime by
the users.
3. View Report
In these individual reports, users can add,
edit, search, and import data in the tables.
They can also generate scorecards of the
reports in real time.
3. View Report
In these individual reports, users can add,
edit, search, and import data in the tables.
They can also generate scorecards of the
reports in real time.
2. Manage Reports
All the reports are saved and organized
automatically by the date created. Users
can search sort and filter the reports based
on their date, score and edit history.
1. Dashboard
A dashboard which shows all the important
& frequently used features at one place to
navigate faster. Users can quickly view, edit
and compare scores from different reports.
Information Architecture
User flow diagrams
Wireframing
Iterating user interface
As we moved on to designing the interface of the application, I wireframed all the UI screens and conducted an intial user testing session.
Defining Patterns
Design Style Guide
High Fidelity
Visual Design
Conclusion
Overall Impact
The web app is currently used by Quality Improvement Advisors (QIA) to guide 15,000+ clinicians across
universities, health systems and independent provider-practices in major of the domestic states
This tool is helping healthcare institutions to save thousands of dollar and increasing the quality of patient care by incentivising the performance of physicians, providers etc.
The Challenge
Create a performance data reporting system to reduce the overall administrative burdens for physicians and advisors
In 2017, 73% of hospitals were penalized by the govt. due to their inability to report data about the quality of service provided to the patients. Tracking this data can prevent penalties and ensure that better care is provided.